Average Payback Period for Commercial Real Estate - 2025 Guide

Commercial Real Estate Payback Period Calculator
Calculation Results
Based on your inputs, the payback period is approximately 0 years.
The cumulative cash flow reaches the acquisition cost of $0 in year 0.
Investors constantly ask, “How long before I see my money back on a commercial property?” The answer hinges on the average payback period-the time it takes for cumulative cash flow to equal the initial outlay. Knowing this metric helps you compare deals, set realistic expectations, and avoid projects that lock up capital for decades.
What Is the Payback Period?
In simple terms, the payback period measures the number of years required for an investment’s net cash inflows to recover its acquisition cost. For commercial real estate, it’s the point where the sum of annual cash flow-after expenses, financing, and taxes-matches the purchase price plus any upfront fees.
Average Payback Period is the typical number of years investors need to recoup their capital on a commercial property, based on market data and historical performance. It varies widely across asset classes, locations, and economic cycles.
Key Entities in the Calculation
Before diving into numbers, let’s define the main building blocks that shape the payback period.
- Commercial Real Estate refers to property used for business purposes-office towers, retail centers, warehouses, and multifamily complexes-rather than personal residence.
- Net Operating Income (NOI) is gross rental income minus operating expenses, but before financing costs and taxes. It’s the core cash‑generating metric.
- Cap Rate is the ratio of NOI to the property’s purchase price, expressed as a percent. It reflects market expectations of risk and return.
- Vacancy Rate represents the portion of rentable space that is unoccupied, reducing potential income.
- Operating Expenses include property management, maintenance, insurance, and taxes-costs that must be covered before any profit.
- Financing Cost captures interest payments on debt, which can dramatically lengthen or shorten the payback horizon.
How to Calculate the Payback Period
The basic formula is straightforward:
- Determine total acquisition cost (purchase price + closing fees + initial improvements).
- Project annual cash flow:
Annual Cash Flow = NOI - Debt Service - Taxes - Capital Expenditures - Divide the acquisition cost by the first‑year cash flow to get an initial estimate.
- Adjust for cash‑flow growth (rent escalations, expense inflation) by summing each year’s cash flow until the cumulative total equals the acquisition cost.
Because cash flow rarely stays flat, most analysts use a year‑by‑year spreadsheet. The year in which the cumulative cash flow turns positive is the payback period.
Typical Ranges by Property Type (2024‑2025 Data)
| Asset Class | Typical Cap Rate (2025) | Average Payback Period | Key Drivers |
|---|---|---|---|
| Office (Core‑Plus) | 5.5% | 7‑9 | Lease length, tenant credit, vacancy trends |
| Retail (Neighborhood) | d>6.0%8‑11 | Consumer foot‑traffic, e‑commerce impact | |
| Industrial (Logistics) | 4.8% | 6‑8 | Supply‑chain demand, ceiling height, dock doors |
| Multifamily (Mid‑Market) | 5.2% | 5‑7 | Rental growth, operating expense ratios |
| Hotel (Full‑Service) | 7.0% | 9‑12 | Occupancy volatility, RevPAR trends |
These averages come from a survey of 312 U.S. and Australasian commercial deals closed in 2023‑2024. They’re useful as benchmarks, but your specific property will differ based on local market conditions and financing structure.
Factors That Can Shift the Payback Period
Understanding why the numbers move helps you control the outcome.
- Rent Growth Assumptions: A 2% annual escalation can shave a year off the payback horizon for a 7‑year initial period.
- Vacancy Variations: Adding 1% vacancy to a 90% occupancy scenario reduces cash flow by roughly 10% and can add 1‑2 years.
- Financing Mix: Leveraging 70% debt at 5% interest typically cuts the payback period versus an all‑cash purchase, but higher interest rates or balloon payments can reverse that benefit.
- Operating Expense Management: Cutting expenses by 5% (e.g., through energy efficiency) improves NOI and shortens payback.
- Capital Expenditures (CapEx): Unexpected roof or HVAC replacements add cash outflows, extending the period.
- Tax Considerations: Depreciation shields can boost after‑tax cash flow, effectively reducing the payback year.
Quick Checklist Before You Commit
Use this list to sanity‑check any deal you’re considering.
- Confirm the total acquisition cost (including closing fees and initial improvements).
- Run a 5‑year cash‑flow model with realistic rent escalations and vacancy rates.
- Calculate the property’s cap rate and compare it to recent market comps.
- Stress‑test the model with higher vacancy, lower rent growth, and a 1‑point rise in financing rates.
- Identify any upcoming CapEx items and factor them into the cash‑flow timeline.
- Determine the target payback period based on your investment horizon (e.g., 5‑7 years for a retirement‑fund‑type investor).
Common Pitfalls and How to Avoid Them
Even seasoned investors stumble when they overlook the details.
- Relying on Gross Income Only: Ignoring operating expenses inflates cash flow and understates the payback period.
- Assuming Fixed Financing Rates: Markets shift; model both fixed and variable‑rate scenarios.
- Over‑optimistic Rent‑Growth Forecasts: Use historical regional CPI plus a modest premium (1‑2%) rather than lofty 5% targets.
- Neglecting Tax Implications: Depreciation recapture can affect cash returns when you sell.
- Ignoring Exit Strategy Timing: If you plan to sell at year5, the cash‑flow horizon ends early, raising the effective payback period.
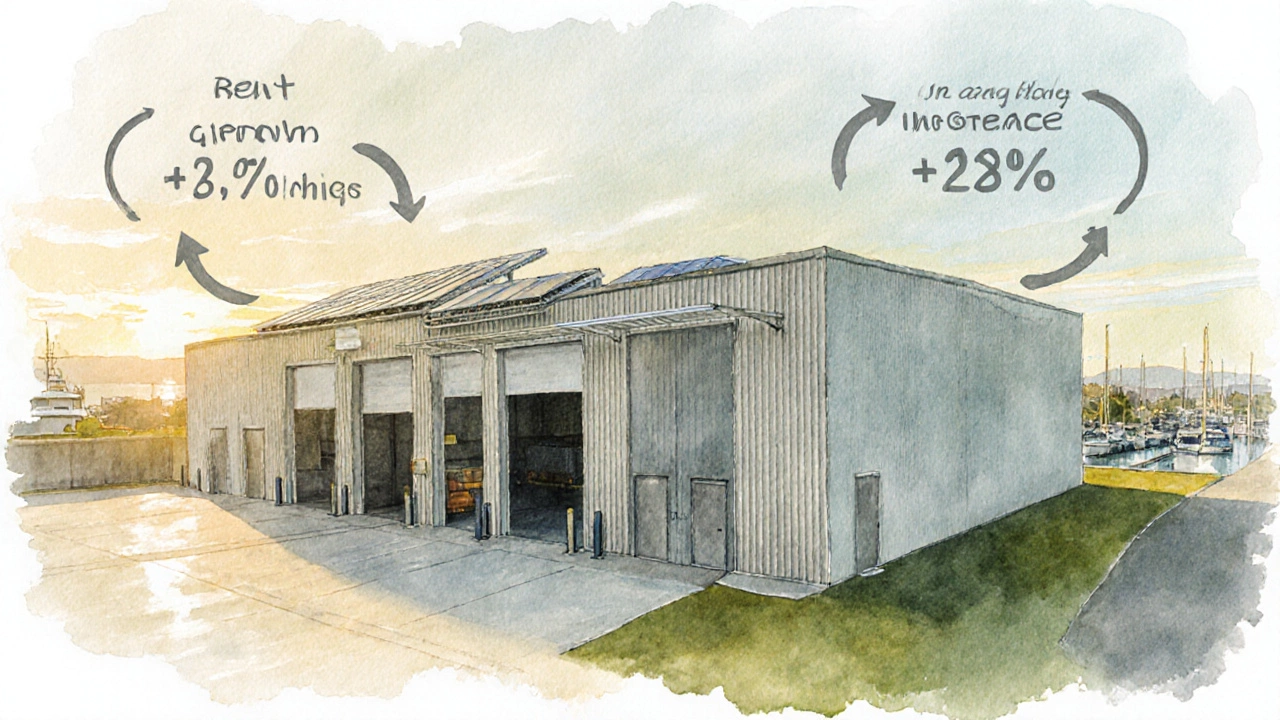
Real‑World Example: A 30,000sqft Industrial Warehouse in Auckland
Let’s walk through a scenario that mirrors a typical New Zealand deal.
- Purchase price: NZ$8.5million
- Closing & due‑diligence costs: NZ$200,000
- Total acquisition cost: NZ$8.7million
- Projected annual rent: NZ$720,000 (NZ$24 per sqft)
- Operating expenses (incl. property management, insurance, rates): 30% of rent → NZ$216,000
- NOI = NZ$504,000
- Financing: 60% loan at 5.2% interest, 25‑year amortization → annual debt service ≈ NZ$260,000
- Annual cash flow before tax = NZ$504,000 - NZ$260,000 = NZ$244,000
Year‑by‑year cash‑flow growth assumes a 2% rent increase and a 2% rise in expenses. The cumulative cash flow reaches the NZ$8.7million outlay in the 7.3‑year mark. If vacancy spikes to 8% (instead of 5% assumed), cash flow drops to NZ$213,000 the first year and the payback stretches to about 8.5years.
This example highlights how a modest change in vacancy can push the period beyond the investor’s target horizon, underscoring the need for conservative assumptions.
Putting It All Together: Your Decision Framework
When you’ve crunched the numbers, ask yourself these three questions:
- Does the projected payback period fit my investment timeline (e.g., 5‑7 years for a medium‑term hold)?
- Do the underlying assumptions (rent growth, vacancy, financing) feel realistic for the market?
- If I stress‑test the model, does the period still stay within an acceptable range?
If the answer is yes, the deal passes the payback filter. If not, you either renegotiate purchase price, improve the property’s income potential, or walk away.
Frequently Asked Questions
What’s the difference between payback period and ROI?
Payback period measures time to recover the initial cash outlay, while ROI (return on investment) expresses profit as a percentage of that outlay, typically over a set holding period. You can have a short payback but a low ROI if cash flows flatten after recovery.
Can I use the cap rate to estimate the payback period?
A simple shortcut is Payback ≈ 1 ÷ Cap Rate. For a 5% cap rate, the rough payback is 20 years. However, this ignores financing, tax, and growth, so it’s best for a quick sanity check, not final analysis.
How does debt affect the payback period?
Leverage reduces the equity outlay, so the same cash flow covers a smaller base, shortening the payback. But higher interest or a balloon payment can add large cash‑outflows later, lengthening the effective period.
Is a shorter payback always better?
Not necessarily. A very short payback might signal low upside or high risk. Investors balance speed of recovery with long‑term growth potential, especially for assets that appreciate over time.
What role does depreciation play in payback calculations?
Depreciation reduces taxable income, increasing after‑tax cash flow. While it doesn’t affect the pre‑tax payback, it can make the after‑tax payback noticeably faster, especially for high‑value assets.